6am Candle High/Low Indicator with Highlight6am Candle High/Low Indicator with Highlight
6am Candle High/Low Indicator with Highlight
6am Candle High/Low Indicator with Highlight
6am Candle High/Low Indicator with Highlight 6am Candle High/Low Indicator with Highlight
Pesquisar nos scripts por "high low"

Multi HTF High/Low LevelsThis indicator plots the previous high and low from up to four user-defined higher timeframes (HTF), providing crucial levels of support and resistance. It's designed to be both powerful and clean, giving you a clear view of the market structure from multiple perspectives without cluttering your chart.
Key Features:
Four Customizable Timeframes: Configure up to four distinct higher timeframes (e.g., 1-hour, 4-hour, Daily, Weekly) to see the levels that matter most to your trading style.
Automatic Visibility: The indicator is smart. It automatically hides levels from any timeframe that is lower than your current chart's timeframe. For example, if you're viewing a Daily chart, the 4-hour levels won't be shown.
Clean On-Chart Lines: The high and low for each timeframe are displayed as clean, extended horizontal lines, but only for the duration of the current higher-timeframe period. This keeps your historical chart clean while still showing the most relevant current levels.
Persistent Price Scale Labels: For easy reference, the price of each high and low is always visible on the price scale and in the data window. This is achieved with an invisible plot, giving you the accessibility of a plot without the visual noise.
How to Use:
Go into the indicator settings.
Under each "Timeframe" group, check the "Show" box to enable that specific timeframe.
Select your desired timeframe from the dropdown menu.
The indicator will automatically calculate and display the previous high and low for each enabled timeframe.

Daily High/Low (15m) + EMA Pre-Market H/L + ORBStraightforward:
I built a swing-trading indicator with ChatGPT that plots 15-minute highs and lows, draws pre-market high/low lines, and adds a 15-minute opening-range breakout feature.
Technical:
Using ChatGPT, I developed a swing-trade indicator that calculates 15-minute highs/lows, overlays pre-market high and low levels, and includes a 15-minute Opening Range Breakout (ORB) module.
Promotional:
I created a ChatGPT-powered swing-trading indicator that maps 15-minute highs/lows, marks pre-market levels, and features a 15-minute Opening Range Breakout for clearer entries.

Weekly High/Low Weekday Stats by [M1rage]Weekly High/Low Weekday Stats by
---------------------------------------------------------------------------------------------------------------------
Индикатор показывает, в какие дни недели чаще всего формируются недельные High и Low инструмента. Поддерживает режимы 24/5 (FX) и 24/7 (крипто). Работает на Daily (D) таймфрейме.
Что делает:
Скользит по дневным барам, собирает недельные экстремумы.
Для каждой завершённой недели фиксирует день недели недельного High и Low.
Строит таблицу-частот Mon..Fri (24/5) или Mon..Sun (24/7) с процентами/счётчиками.
Опционально помечает на графике лейблами бары, где сформировались недельные High/Low (для быстрой визуальной проверки).
Параметры:
Lookback (years) — глубина истории (примерно 52 недели × годы).
Show percentages — показывать проценты.
Show raw counts — показывать «сырые» счётчики.
Show debug labels (weekly H/L) — лейблы H/L на графике для завершённых недель.
Debug: keep last N weeks — сколько последних недель держать на графике лейблами (старые удаляются).
Market mode — режим рынка: 24/5 (Mon..Fri) или 24/7 (Mon..Sun).
Table theme — цветовая тема таблицы: Dark Theme / Light Theme
(меняет цвет текста, шапки, внешней рамки и внутренних границ).
Очень короткие праздничные недели фильтруются, чтобы не искажать статистику.
---------------------------------------------------------------------------------------------------------------------
The indicator shows on which weekdays a symbol most often sets its weekly High and Low. It supports 24/5 (FX) and 24/7 (crypto) modes. Works on the Daily (D) timeframe.
What it does:
Scans daily bars to build weekly extremes.
For each completed week, records the weekday of the weekly High and Low.
Builds a frequency table Mon–Fri (24/5) or Mon–Sun (24/7) with percentages/counts.
Optionally labels on the chart the bars where the weekly High/Low formed (for quick visual verification).
Inputs:
Lookback (years) — history depth (≈ 52 weeks × years).
Show percentages — display percentages.
Show raw counts — display raw counts.
Show debug labels (weekly H/L) — H/L labels on the chart for completed weeks.
Debug: keep last N weeks — how many recent weeks to keep as labels on the chart (older labels are deleted).
Market mode — market schedule: 24/5 (Mon–Fri) or 24/7 (Mon–Sun).
Table theme — table color theme: Dark Theme / Light Theme (changes text color, header, outer frame, and inner grid).
Very short holiday weeks are filtered out to avoid skewing the statistics.

Enhanced 4H Candle Countdown & High/Low IndicatorBy profitgang
This Pine Script indicator provides real-time tracking of 4-hour timeframe levels with an integrated countdown timer, designed to help traders monitor key support and resistance zones.
Key Features
📊 Visual Elements
4H High/Low Lines: Clear visualization of previous 4-hour candle high and low levels
Range Fill: Subtle background fill between high and low for better context
Mid-Level Line: Shows the middle point of the 4H range
Position Indicator: Visual cue showing current price position within the range
⏰ Countdown Timer
Real-time countdown to next 4H candle close
Customizable table position (9 different locations)
Adjustable text size (6 size options from Tiny to Huge)
Distance calculations showing percentage distance from key levels
🎯 Signal Generation
Long signals when price crosses above 4H low
Short signals when price crosses below 4H high
RSI confluence filter to reduce false signals
Background highlighting for active signals
TradingView alerts compatible
⚙️ Customization Options
Toggle all features on/off independently
Custom colors for all elements
Table positioning (top/middle/bottom + left/center/right)
Text size selection for optimal readability
Alert notifications for level breaks and updates
How It Works
The indicator fetches the previous 4-hour candle's high and low values and displays them as horizontal lines on your current timeframe chart. It continuously calculates the time remaining until the current 4H candle closes and presents this information in a clean, customizable table.
Use Cases
Swing Trading: Identify key 4H support and resistance levels
Intraday Trading: Monitor when new 4H levels will be established
Risk Management: Calculate distance from key levels for position sizing
Multi-timeframe Analysis: Combine with lower timeframe setups
Educational Purpose
This indicator is designed for educational and analytical purposes to help traders understand price action relative to higher timeframe levels. It provides clear visual feedback about market structure and timing.
Settings Groups
Display Settings: Toggle features, positioning, and sizing
Colors: Customize all visual elements
Signal Settings: Configure alert conditions and confluence filters
Compatibility
Works on all timeframes (recommended for 1m to 1H charts)
Compatible with all instruments
Includes proper alert functionality for automated notifications
Optimized for both light and dark themes
This indicator does not provide financial advice. Always conduct your own research and risk management before making trading decisions.

TBL HTF Highs&LowsThis script plots the previous Daily, Weekly, and Monthly High and Low levels directly on your chart, helping you identify key higher-timeframe support and resistance zones.
Features:
Daily, Weekly, Monthly Lines: Toggle visibility for each timeframe's high/low levels.
Customization Options:
Choose color, style (Solid, Dashed, Dotted), width, and transparency for each line type.
Automatic Updates: Lines update at the start of each new session (day, week, or month).
Summary Table: Displays the latest Pre-Daily High/Low (PDH/PDL), Pre-Weekly High/Low (PWH/PWL), and Pre-Monthly High/Low (PMH/PML) in the top-right corner of the chart.
Configurable Table Font Size: Choose between Tiny, Small, Medium, or Large text.
Use Case:
Ideal for traders who rely on key higher-timeframe levels for confluence, breakout trading, or mean-reversion strategies. The visual lines and summary table provide instant context without cluttering your chart.

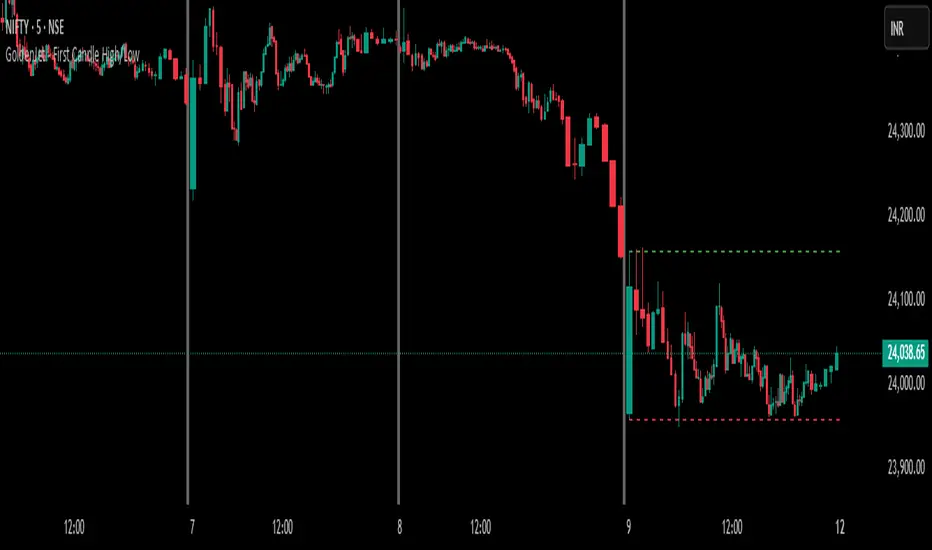
GoldenJet - First Candle High/LowThe "First Candle High/Low" indicator is a custom intraday trading tool designed for use on intraday charts (e.g., 1-minute, 5-minute, 15-minute). It automatically marks the high and low of the first completed candle of the trading day using horizontal dashed lines. These lines are extended visually across the chart until the end of the day, allowing traders to reference them easily throughout the session.
The first candle of the day is identified by detecting a new calendar day.
The high and low from that candle are stored and used as key levels.
The levels are displayed as horizontal lines from the first candle's time up to day end
✅ Benefits of This Indicator for Intraday Traders
Establishes Key Reference Points Early:
The high and low of the first candle often act as early indicators of intraday support and resistance.
Helps identify the day's potential range and momentum.
Improves Trade Planning:
You can use the levels to set breakout or reversal entries.
Helps in defining stop-loss and take-profit zones based on these levels.
Supports Multiple Strategies:
Useful in breakout trading, where a break above the first candle high might indicate bullish momentum.
Helpful in mean-reversion or range trading, where price bouncing between high and low can be exploited.
Enhances Risk Management:
By marking predefined levels, you avoid emotionally-driven entries.
Lines provide a clear visual cue for when to act or wait.
Works Across Markets and Instruments:
Applicable to stocks, indices, futures, forex, and crypto — anywhere intraday price action matters.
Equal High/Low (EQH/EQL) [AlgoAlpha]OVERVIEW
This script detects and visualizes Equal High (EQH) and Equal Low (EQL) zones—key liquidity areas where price has previously stalled or reversed. These levels often attract institutional interest due to the liquidity buildup around them. The indicator is built to highlight such zones using dynamic thresholding, overbought/oversold RSI filtering, and adaptive mitigation logic to manage zone relevance over time.
CONCEPTS
Equal Highs/Lows are price points where the market has repeatedly failed to break past a certain high or low, hinting at areas where stop orders and pending interest may be concentrated. These areas are often prime targets for liquidity grabs or reversals. By combining this with RSI filtering, the script avoids false signals during neutral conditions and instead focuses on zones where market pressure is more directional.
FEATURES
Detection Logic: The script identifies EQH and EQL zones by comparing the similarity between recent highs or lows with a dynamic volatility threshold. The `tolerance` input allows users to control how strict this comparison is.
RSI Filtering: If enabled, it only creates zones when RSI is significantly overbought or oversold (based on the `state_thresh` input). This helps ensure zones form only in meaningful market conditions.
Zone Display: Bullish (EQL) zones are shown in grey, while bearish (EQH) zones are in blue. Two horizontal lines mark the zone using wick and body extremes, and a filled area visualizes the zone between them.
Zone Management: Zones automatically extend with price until they’re invalidated. You can choose whether a zone is removed based on wick or body sweeps and whether it requires one or two candle confirmations. Zones also expire after a customizable number of bars.
Alerts: Four alert conditions are built in—when a new EQH/EQL is formed and when one is mitigated—making it easy to integrate into alert-based workflows.
USAGE
Equal highs/lows can be used as liquidity markers, either as entry points or as take-profit targets.
This tool is ideal for liquidity-based strategies and helps traders map out possible reversal or sweep zones that often precede aggressive moves.

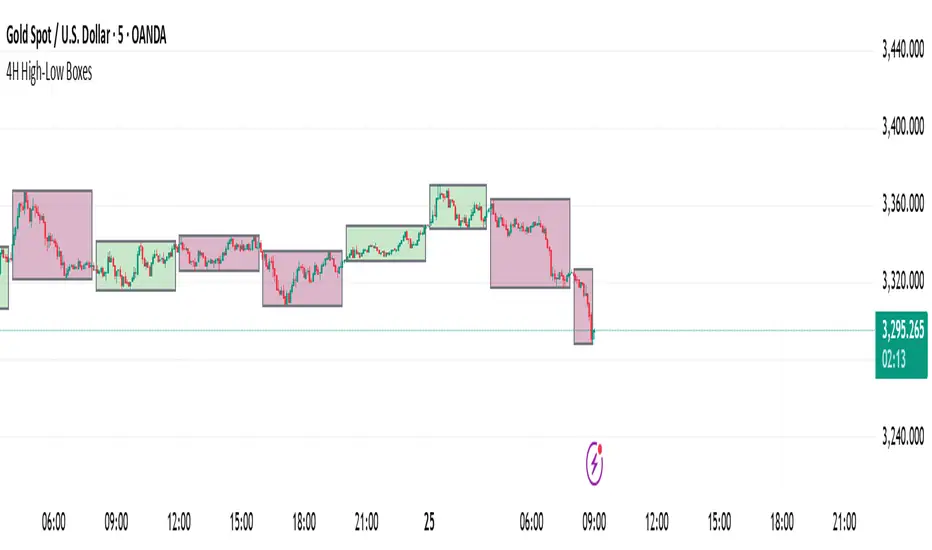
4H High-Low BoxesThis indicator dynamically plots high-low boxes based on the most recent 4-hour candle, providing visual markers for key price levels and trends. The box is updated in real-time to reflect the highest and lowest points of the current 4-hour candle, and its color changes based on the market's direction.
Key Features:
Dynamic Boxes: The indicator automatically adjusts to the 4-hour candle's high, low, and open price, creating a box that updates with price action.
Color-Coding: The box color changes based on the price direction. A green box indicates bullish market sentiment (price is above the 4H open), while a red box indicates bearish sentiment (price is below the 4H open).
Accurate Timeframe Representation: It works across any intraday timeframe (e.g., 5-minute, 15-minute, 1-hour), providing consistent, visually relevant markers for trading decisions.
Real-Time Updates: The box is adjusted dynamically as price evolves, ensuring it accurately represents the 4-hour price range during live trading.
Customizable Settings: Tailor the visual aspects of the box, including border color, background transparency, and other parameters.
Trading Strategy Ideas:
Rejection at High/Low: Look for price rejection at the 4H high/low for potential reversal signals.
Breakout Strategy: Trade breakouts above the 4H high or below the 4H low for momentum trades.
Mean Reversion: Enter when price moves away from the 4H open, expecting it to return to the open price.
This indicator can be used as a standalone tool or combined with other technical indicators to improve entry and exit points. Perfect for swing traders and those using price action to identify key support and resistance levels.
HAPPY TRADING
Open/Close/High/Low [AlecVosika]Open/Close/High/Low Indicator
Description:
This indicator plots horizontal lines for the previous session's Open, High, Low, and Close prices on your chart, providing a clear visual reference for key price levels. Designed for traders who want to track session-based price action, it supports customizable display modes, line styles, colors, and labels. Ideal for day traders or anyone analyzing price behavior relative to prior sessions.
Features:
Display Modes: Choose to show lines for "Today" (previous session), "Two Days," "Week," or "All" sessions. Option to hide lines entirely.
Customizable Lines: Select solid, dashed, or dotted lines with adjustable width and individual colors for Open, High, Low, and Close.
Labels: Optional labels with customizable font size and offset, displaying the price level and type (e.g., "Prev Open (123.45)").
Session Control: Configurable session time (default 08:30-15:00) and timezone (UTC-8 to UTC+0) to align with your market.
Dynamic Updates: Lines extend during the current session and are cleaned up based on the selected display mode to keep the chart uncluttered.
How It Works:
Tracks the Open, High, Low, and Close of each session (default 08:30-15:00 in the selected timezone).
On a new session start, plots the previous session's levels as horizontal lines.
Lines persist according to the chosen display mode, with older lines removed automatically (except in "All" mode).
Labels (if enabled) appear with a configurable offset from the line end for easy reading.
Settings:
Configuration:
Display Mode: Hidden, Today, Two Days, Week, All
Line Properties:
Line Style: Solid, Dashed, Dotted
Line Width: 1 to 5
Colors: Individual colors for Open, High, Low, Close
Label Properties:
Show Labels: Toggle on/off
Font Size: Tiny, Small, Medium, Large
Label Offset: Bars from the end of the line (1-10)
Session Settings:
Session Timezone: UTC-8, UTC-7, UTC-6, UTC-5, UTC-4, UTC+0
Usage Tips:
Use "Today" mode for a clean, single-session focus, or "Week" for broader context.
Adjust colors and line styles to match your chart theme.
Enable labels for quick reference or disable them for a minimalist look.
Author: AlecVosika
Version: 6
Published: 3/21/2025

Daily & Multi-Day High/LowDaily & Multi-Candle High/Low Indicator
This indicator clearly highlights essential price levels directly on your chart, significantly improving your trading decisions:
First Candle High/Low (Session Open):
Quickly identify the high and low of the first candle each trading day, ideal for session-open traders.
Previous Day's High/Low:
Automatically plots the highest and lowest prices from the previous trading day, crucial for daily breakout or reversal strategies.
Multi-Candle High/Low (Customizable Period):
Easily track the highest and lowest points of the last X candles (default: 108 candles). Perfect for spotting key support and resistance zones.
Customization Options:
Adjust colors, line styles (solid, dashed, dotted), and line thickness directly from the settings for personalized visibility.
Ideal for day traders, swing traders, and price-action traders looking for clear and actionable daily levels on their charts.
Double Zone High/Low with FillThis indicator, "Double Zone High/Low with Fill", identifies two specific time zones during the trading day and marks their high and low levels. It extends these levels until a user-defined stop time. Additionally, the indicator visually fills the area between the high and low levels for better clarity.
Key Features:
Two Time Zones:
Zone 1: From 00:00 to 00:30 (configurable).
Zone 2: From 09:30 to 10:00 (configurable).
Custom Stop Time:
Users can define the time at which the lines and fills stop (e.g., 16:00 by default).
Visual Fill:
The space between the high and low lines is filled with a transparent color for each zone, improving chart readability.
Dynamic Levels:
The high and low are dynamically updated during the respective time zones and stay fixed after the zone ends.
This indicator is helpful for traders who want to monitor key price levels during specific periods and observe their behavior throughout the trading session.

Dynamic Customizable 50% Line & Daily High/Low + True Day OpenA Unique Indicator for Precise Market-Level Analysis
This indicator is a fully integrated solution that automates complex market-level calculations and visualizations, offering traders a tool that goes beyond the functionality of existing open-source alternatives. By seamlessly combining several trading concepts into a single script, it delivers efficiency, accuracy, and customization that cater to both novice and professional traders.
Key Features: A Breakdown of What Makes It Unique
1. Adaptive Daily Highs and Lows
Automatically detects and plots daily high and low levels based on the selected time frame, dynamically updating in real time.
Features session-based adjustments, allowing traders to focus on levels that matter for specific trading sessions (e.g., London, New York).
Fully customizable styling, visibility, and alerts tailored to each trader’s preferences.
How It Works:
The indicator calculates daily high and low levels directly from price data, integrating session-specific time offsets to account for global trading hours. These levels provide traders with clear visual markers for key liquidity zones.
2. Automated ICT 50% Range Line
A pioneering implementation of ICT’s mid-range concept, this feature dynamically calculates and displays the midpoint of the daily range.
Offers traders a visual guide to identify premium and discount zones, aiding in determining market bias and potential trade setups.
How It Works:
The script calculates the range between the day’s high and low, dividing it by two to generate the midline. This line updates in real-time, ensuring that traders always see the most current premium and discount levels as price action evolves.
3. Dynamic Market Open Levels
Plots session opens (e.g., Asia, London, New York) and the True Day Open to provide actionable reference points for intra-day trading strategies.
Enhances precision in identifying liquidity shifts and aligning trades with institutional price movements.
How It Works:
The indicator uses predefined session times to calculate and display the opening levels for key trading sessions. It dynamically adjusts for time zones, ensuring accuracy regardless of the trader’s location.
4. Custom Watermark for Enhanced Visualization
Includes an optional watermark feature that allows users to display custom text on their charts.
Ideal for personalization, branding, or highlighting session notes without disrupting the clarity of the chart.
Why This Indicator Stands Out
First-to-Market Automation:
While the ICT 50% range line is a widely recognized concept, this is the first script to automate its calculation, combining it with other pivotal trading levels in a single tool.
All-in-One Functionality:
Unlike open-source alternatives that focus on individual features, this script integrates daily highs/lows, mid-range levels, session opens, and customizable watermarks into one cohesive system. The consolidation reduces the need for multiple indicators and ensures a clean, efficient chart setup.
Dynamic Customization:
Every feature can be adjusted to align with a trader’s strategy, time zone, or aesthetic preferences. This level of adaptability is unmatched in existing tools.
Proprietary Logic:
The indicator’s underlying calculations are built from scratch, leveraging advanced programming techniques to ensure accuracy and reliability. These proprietary methods differentiate it from similar open-source scripts.
How to Use This Indicator
Apply the Indicator:
Add it to your TradingView chart from the library.
Configure Settings:
Use the intuitive settings panel to adjust plotted levels, colors, styles, and visibility. Tailor the indicator to your trading strategy.
Incorporate into Analysis:
Combine the plotted levels with your preferred trading approach to identify liquidity zones, establish market bias, and pinpoint potential reversals or entries.
Stay Focused:
With all key levels automated and updated in real time, traders can focus on execution rather than manual plotting.
Originality and Justification for Closed Source
This script is closed-source due to its unique combination of features and proprietary logic that automates complex trading concepts like the ICT 50% range line and session-specific levels. Open-source alternatives lack this level of integration and customization, making this indicator a valuable and original contribution to the TradingView ecosystem.
What Sets It Apart from Open-Source Scripts?
Unlike open-source tools, this indicator doesn’t just replicate individual features—it enhances and integrates them into a seamless, all-in-one solution that offers traders a more efficient and effective way to analyze the market.

Prev Week & Day High/Low LinesTitle:
Advanced Weekly & Daily High/Low Levels with Alerts and Customization
Description:
This indicator automatically plots the high and low levels of the previous week and day, featuring advanced customization options and configurable alerts. It’s a powerful tool for traders who want to identify key support and resistance zones on any timeframe below weekly.
What Does This Indicator Do?
1. Identifies historical levels: Calculates and plots the highs and lows of the previous week and day, helping traders spot reversal points, zones of interest, and decision-making levels.
2. Real-time alerts: Notifies traders when the price approaches or crosses these key levels, allowing them to make decisions without constantly monitoring the chart.
3. Dynamic colors: Changes the color of the levels based on the price proximity, providing a clear visual signal about the immediate importance of each level.
Key Features
1. Total Customization:
• Fully adjustable line colors, styles (solid or dotted), and thicknesses.
• Optional labels for each level with customizable text, size, and position.
• Adaptable configurations to suit different trading styles (scalping, swing trading, intraday).
2. Smart Alerts:
• Set alerts when the price touches or approaches the plotted levels.
• Instant notifications, ideal for trading breakouts or pullbacks at key levels.
3. Optimization and Efficiency:
• Works on all timeframes below weekly, avoiding unnecessary calculations.
• Real-time updates to ensure levels are always accurate.
4. Clear Visualization:
• Dynamic colors for levels close to the current price.
• Projected lines extending into the future to help plan trades.
• Advanced label options, including customizable text and different chart positions.
How It Works
The indicator uses advanced logic to automatically detect day and week transitions based on market time. It calculates and updates the high and low levels efficiently, ensuring that the data reflects the active timeframe. The levels can be projected forward and highlighted with customizable colors and labels.
Additionally, with configurable alerts, traders can receive real-time notifications when the price interacts with these levels, enabling them to respond quickly to market changes.
How to Use It
1. Add the indicator: Apply it to your chart in TradingView.
2. Set up the options:
• Customize the colors, thicknesses, and styles of the lines.
• Adjust the label text and position to suit your preferences.
• Enable alerts for key levels.
3. Utilize the levels: Watch the indicator automatically plot the high and low levels, and use the visual signals and alerts to make informed trading decisions.
Benefits for Traders
• Saves time: No need to manually calculate historical support and resistance levels.
• Improves accuracy: Levels are automatically recalculated and updated in real-time.
• Versatility: Perfect for any trading style (scalping, swing, intraday).
• Real-time alerts: Stay informed about key levels even when not watching the chart.
• Intuitive visualization: Dynamic colors and adjustable labels make technical analysis easier.
Note:
This indicator is unique due to its configurable alerts, advanced customization options, and dynamic colors, setting it apart from similar scripts available on TradingView. It is designed for traders seeking a clear and functional visual tool to make quick and accurate market decisions.

First 5 Minutes Open/Close LinesThis very simple indicator paints lines at the high and low of the first 5m candle of the session. It is primarily intended for big cap NYSE traded stocks with high volume. I wrote this indicator to save me the trouble of manually drawing the lines each day.
The lines drawn at the 5m high/low will remain constant regardless of which timeframe you switch to. In the example screenshot, we are looking at the 1m timeframe. This helps us switch effortlessly between different timeframes to see if a given price movement meets our entry criteria.
In addition to drawing lines at the first 5m high/low, it will optionally paint two zones, one each around the high and low. The boundaries of this zone are configurable and expressed as a percentage of the total movement of the first 5m bar. By default, it is set to 25%.
This indicator is based on the concept that the first 5m bar always has massive volume which helps us infer that price may react around the extremes of that movement. The basic strategy works something like this:
- You identify the high timeframe (HTF) trend direction of the stock
- You wait for the first 5m candle of the session to close
- You wait for price to puncture through the outer boundary of the zone marked by the indicator.
- You enter when price retraces to the high, or low, which marks the midpoint of the punctured zone.
- Only enter long on stocks in a HTF uptrend, and short on stocks in an HTF downtrend.
- Use market structure to identify stop loss and take profit targets
Note: Use at your own risk. This indicator and the strategy described herein are not in any way financial advice, nor does the author of this script make any claims about the effectiveness of this strategy, which may depend highly on the discretion and skill of the trader executing it, among many other factors outside of the author's control. The author of this script accepts no liability, and is not responsible for any trading decisions that you may or may not make as a result of this indicator. You should expect to lose money if using this indicator.

First Candle High Low LevelsDescription
The "First Candle High Low Levels" Pine Script indicator is designed to highlight the high and low levels of the first candle of the day on your TradingView chart. It works across different timeframes and specifically handles the Indian stock market trading hours (9:15 AM to 3:30 PM IST). The script draws a box from the start to the end of the trading session, visually marking the price range defined by the first candle of the day. Traders can customize the box's border color, fill color, and line width.
Features
Customizable Timeframe: Users can select the desired timeframe for the first candle (e.g., 5-minute, 15-minute, etc.).
Custom Box Appearance: Options to adjust the border color, fill color, and line width of the drawn box.
Auto Reset for Each New Day: The high and low of the first candle are reset daily to mark the start of the next trading day.
Accurate Market Session Handling: The box is drawn from the start of the first candle to the end of the trading session (3:30 PM IST).
Usage
Adding to Chart: Apply the script by copying it into the Pine Script editor in TradingView. Once added, the script will automatically draw a box representing the high and low of the first candle of the day.
Select Timeframe: You can adjust the First Candle Timeframe input to define which timeframe candle will be used for marking the high and low. For example, if you choose a 5-minute timeframe, the high and low of the first 5-minute candle will be used.
Customization:
Adjust the Border Color and Box Fill Color through the input settings to match your chart's style.
Modify the Box Line Width to make the box lines more or less prominent.

Historical Swing High-Low Gann IndicatorThe Historical Swing High-Low Gann Indicator is a powerful tool designed to track and visualize key market swing points over time. This indicator identifies significant swing highs and lows within a specified time frame and draws connecting lines between these points, allowing traders to observe the natural ebb and flow of the market.
What sets this indicator apart is its ability to maintain all previously drawn swing lines, creating a comprehensive historical view of market movements. Additionally, the indicator projects Gann-style lines from the most recent swing highs and lows, providing traders with potential future support and resistance levels based on the geometric progression of price action.
Features:
Swing Detection: Automatically detects significant swing highs and lows over a user-defined period (default is 3 hours).
Persistent Historical Lines: Keeps all previously drawn lines, offering a complete visual history of the market's swing points.
Gann-Style Projections: Draws forward-looking lines from the latest swing points to help predict possible future market levels.
Customizable Parameters: Allows users to adjust the swing detection period to suit different trading styles and time frames.
This indicator is ideal for traders who rely on price action, support and resistance levels, and Gann theory for their analysis. Whether used in isolation or as part of a broader strategy, the Historical Swing High-Low Gann Indicator provides valuable insights into the market's behavior over time.

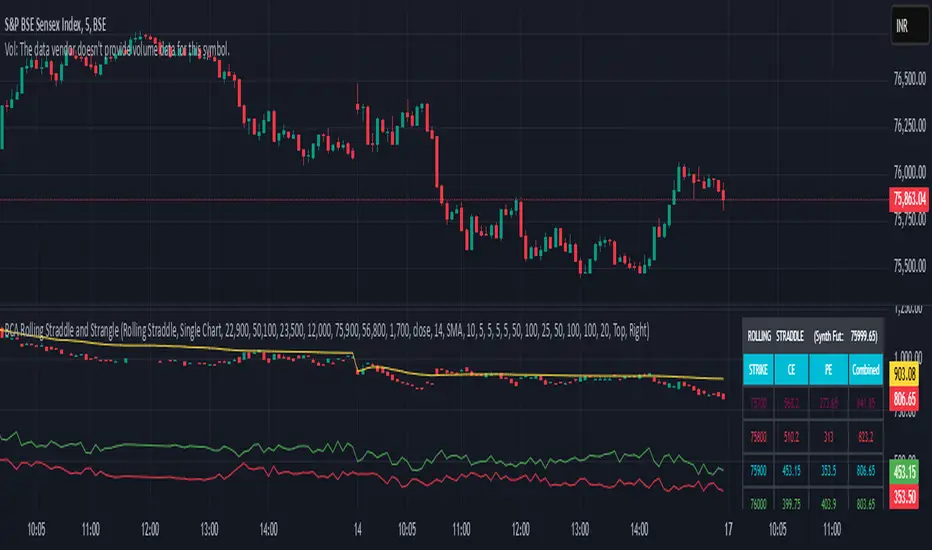
Rolling Straddle with swing High/Low [Bluechip Algos]The Rolling Straddle and Strangle indicator is designed for options traders, particularly those trading in Indian indices such as NIFTY, BANKNIFTY, and others. This script not only allows users to analyze rolling straddle and strangle strategies by plotting various metrics but also has several indicators to apply on top of straddle/strangle charts. Especially indicators like swing high/low and ATR stop loss help you identify potential entry and exit points respectively.
About the Indicator
This indicator plots rolling straddles and strangles based on the selected symbol, strike prices, and expiry dates. Users can choose between analyzing single or multiple charts, and the script dynamically adjusts for different symbols, including NIFTY, BANKNIFTY, and other indices. Additionally, it incorporates several popular technical indicators to assist in decision-making.
Features
Dynamic Strike Price Calculation: Automatically adjusts strike prices based on the selected symbol and ATM (At-The-Money) reference.
Straddle and Strangle Analysis: Offers both rolling straddle and rolling strangle options, providing detailed views of option prices.
Table Plotting: Displays a table with the strike prices and corresponding CE (Call) and PE (Put) prices, including combined values.
Integrated Indicators: Includes customizable indicators such as Swing High/Low levels, ATR Stop Loss, Moving Averages, SuperTrend, and VWAP each designed to enhance strategy analysis.
Understanding the Indicator
1. Swing High/Low Levels
Purpose: This indicator identifies swing highs and lows in the price data, which are key levels that traders often use for placing stop-loss orders or for identifying potential reversal points.
Parameters:
Swing Length: The number of bars before and after the current bar that must be lower/higher to confirm a swing high/low.
How It Works: The indicator marks the highest high and lowest low over the specified period, helping traders to identify key support and resistance levels.
2. ATR Stop Loss
Purpose: The ATR Stop Loss is used to determine a dynamic stop-loss level based on the volatility of the asset. It adjusts the stop-loss level as the market conditions change.
Parameters:
ATR Period: The number of periods over which the ATR is calculated.
Multiplier: Factor used to adjust the stop-loss distance from the current price.
How It Works: The stop-loss level is adjusted dynamically based on the ATR value, providing protection against large, unexpected moves.
3. Moving Average (MA)
Purpose: The Moving Average is used to smooth out price data, providing a clearer view of the price trend over time. It is particularly useful for identifying the direction of the trend.
Parameters:
MA Source: The data series used for calculating the Moving Average (e.g., Close price).
MA Length: The number of periods over which the Moving Average is calculated.
MA Smoothing: The method used for smoothing the data, such as SMA (Simple Moving Average), EMA (Exponential Moving Average), WMA (Weighted Moving Average), or RMA (Running Moving Average).
4. SuperTrend
Purpose: The SuperTrend indicator is a trend-following indicator that helps traders identify the prevailing trend. It is based on the ATR (Average True Range) and provides clear buy/sell signals.
Parameters:
Factor: Multiplier applied to the ATR to calculate the upper and lower bands.
ATR Period: The period over which the ATR is calculated.
How It Works: When the price is above the SuperTrend line, it indicates a bullish trend, and when the price is below, it indicates a bearish trend.
5. VWAP (Volume Weighted Average Price)
Purpose: VWAP is a trading benchmark used by traders that gives the average price a security has traded at throughout the day, based on both volume and price. It is often used to determine the general direction of the market and as a basis for intraday trading strategies.
How It Works: VWAP calculates the cumulative price-volume divided by the cumulative volume over a specified period, providing a weighted average price that is more reflective of true market activity.
Input Parameters
Chart Type: Select between "Rolling Straddle" and "Rolling Strangle."
Symbol Selection: Choose from NIFTY, BANKNIFTY, MIDCAP, FINNIFTY, SENSEX, BANKEX, or a custom symbol.
Strike Interval: Customize strike intervals for different indices.
Expiry Date: Select the option expiry date.
Table Settings: Configure the table's position and colors for better visibility.
Indicator Settings: Customize each indicator’s parameters to suit your trading strategy, including lengths, smoothing methods, and colors.
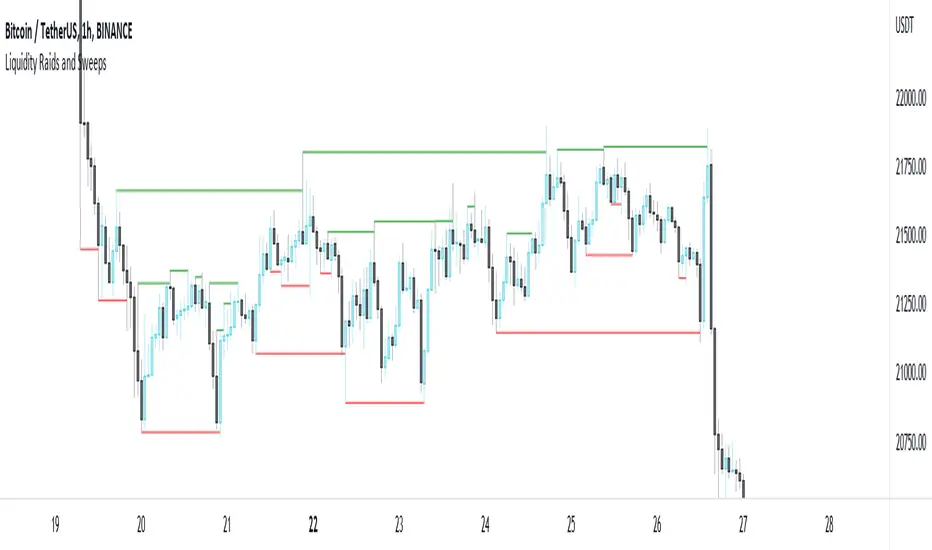
Liquidity Raids and Sweeps by TexmoonbeamLiquidity is a vital concept in trading. It gives us an indication of where buy / sell orders are in the market, and the direction price is likely to move once this liquidity has been taken.
The purpose of this indicator is to show you when and where there has been a 'raid' or 'sweep' of this liquidity, meaning a reversal might occur.
The indicator does this by looking for candle wicks, that go beyond a previous pivot high or low.
Settings:
Timeframe – This settings changes the timeframe that the indicator looks for raids/sweeps. Higher timeframes generally mean stronger moves.
Left bars – the number of bars gap higher/lower to the left of a pivot low/high. A higher number means the high or low was formed from a stronger move.
Right bars – the number of bars gap higher/lower to the right of a pivot low/high. A higher number means the high or low started a stronger move.
Max Gap – the maximum number of candles between a raid or sweep. Reduce this number on higher time frames if there are memory errors.
Min Gap – the minimum number of candles between a raid or sweep.
Alerts Wait For Close – If ticked, this means an alert will not be triggered by the current candle wick, overlapping a previous, until the close of that candle. Unticked you will be alerted as soon as the current candle crosses a previous high/low, though it might close far beyond that point and not actually turn out to be a raid/sweep.
Buy Side/Sell Side – line style and colour preferences for buy and sell side.
Strategy:
As seen in the example chart, the raid/sweep of liquidity, where only a wick reaches beyond a previous high or low, can be followed by a reversal of direction, often to seek other liquidity targets. This indicator could provide an opportunity to enter a trade at this point and the alert feature means you will be able to set up custom alerts on multiple charts or timeframes.
You should use other confluence and a lower time frame confirmation after a raid/sweep, to identify your entry, stop loss and targets. Familiarity with liquidity and smart money concepts are recommended.
Swing High/Low Indicator w/ MACD and HTF EMA'sSwing High/Low Indicator w/ MACD and EMA Confirmations by KaizenTraderB
I designed this indicator to be used with a market structure break strategy.
It labels swing highs and lows that are confirmed by the MACD.
It also displays a higher timeframe Fast and Slow EMA to determine directional bias.
Also provides alerts that signal Swing Low breaks in downtrends and Swing High Breaks in uptrends.
It draws a horizontal line on the last Swing High and Low.
Display this indicator on your entry timeframe and choose your Higher Timeframe in settings.
You can also change lookback period for Swing Highs and Lows and EMA's.
When I use this I am looking for the Swing High/Low break in direction of HTF Trend
Then look for pullback between price level of break and areas of liquidity (wicks, order blocks, price congestion) for entry in direction of EMA trend.

Swing Pivots High LowBINANCE:BTCUSDT
This indicator is an opensource merge of the built in 'Pivot Points High Low' and the most popular 'Swing-high-low-support-resistance' indicators. The original 'Pivot Points High Low' does not have extensions with better visibility, while the most popular 'Swing-high-low-support-resistance' has no source available. I've also added additional configurable alert conditions for Pivot High and Low Crossover/Crossunder.
Please read the official documentation for further information about the indicator.

Strat Assistant Alerts and Highs/LowsStrat Assistant FTC Only
----------------------------
█ OVERVIEW
This script is intended to highlight/draw lines for the prior high/low of 30, 60, day, week, month, quarter, as well as create the alerts for when these thresholds get crossed
Input
----------
The script has inputs for every time frame plotted - 30, 60, day, week, month, quarter. All of the following items below can be "modified"
is the high line active? (for the corresponding time frame, will plot the line yes or no - by default only the DAY is displayed)
is the low line active? (for the corresponding time frame, will plot the line yes or no - by default only the DAY is displayed))
The high line color - modify the color of the corresponding time frame high line to your liking
The low line color - modify the color of the corresponding time frame low line to your liking
The time frame line width - make some lines wider than others for easier distinction
Output
----------
Lines for each corresponding time frame activated in the selected color and width.
Custom alerts - open a stock, select the Alerts button at the top, click the condition as the name of this script. The next drop down will show you all the corresponding alerts you can set for the current price crossing above the prior timelines high or below the prior timelines low (the bracket number is just for sorting purposes).
Best Practices
----------
What's not mapped? - Style (you can't drive this by an input, by default day is dashed, the rest are a solid line)
What's not mapped? - Price on the Y axis. I'm still trying to figure this out, not sure you can do it. I can add a label, just gets cluttered fast
Played with this a little bit using crypto, but obviously I can't test out all these alerts without a lot of things moving. Please do your due diligence.
I know a million people are going to want a million things. I can create more alerts coming soon, for now I wanted to start with this. Please and comments or suggestions or feedback and I'll see what I can do. I can create labels (for price) randomly, but it will clutter the screen. Or I can create one big box or table with prices shown.

Realtime All-Time High and All-Time Low Tracker [WIP]This is a study intended to port the work of /u/QuantNomad's "Kozlod - All-time high/low alerts" to pine version 4 without giving any alerts. It is intended to capture the most extreme points on any given price chart in real time, the absolute high and absolute low points. Ideally, the plotted lines would strictly diverge from one another in opposite directions and widen with new highs or lows on a hypothetical "all-time" resolution.
Most of the original code was replaced and I'm trying to resolve a bug where the script fails to register new highs or lows while at the same time making sure that earlier data is plotted correctly. If applied to an asset that has not yet recovered , is just too new, or has not achieved a lower low than its opening price, this indicator ceases to function correctly. This would not be an issue if pine script was more general purpose and had something similar to Python's max(list) function.
Any and all suggestions are welcome. This is simply to serve as a springboard for any programmers trying to design algorithms or strategies that use these variables on any price chart.
Happy Hunting!
- Patch Hemlock
